created April 12, 2006, updated Sept 2009 with more info on data collection using the EIS.
I'm constantly evaluating the performance of my airplane, so I can speak intelligently about the effect of various modifications that I've made throughout it's evolution (wing tips, gap seals, gear leg fairings, etc). The plot above came directly from my EIS (engine information system) during early testing, which feeds my laptop a constant stream of data at the rate of once per second. It's difficult to get much information out of a plot like the one above, other than general trends, especially on a long flight, but after importing the data into a spreadsheet, it can be easily analyzed later for an accurate look at the data that's been gathered. The green line above is altitude, the blue one RPM. The squiggly stuff is the result of a problem with my first EIS unit whereby the RPM and temperature readings were all driven crazy by high temperatures in the cockpit, but that was later fixed by a free replacement. The middle of the chart is five touch and goes. This kind of chart is not really very helpful when it comes to pure numbers, but the tabulated data is invaluable (see details near the bottom of the page), and you can see from the example that you can hold altitude pretty closely if you pay attention (see table below).
A few vital statistics on N56ML's performance:
 Above is a comparison I've made of four different props: a Sensenich 54x54, a Sterba 52x60 (repitched from 54x66), an Aymar Demuth 52x60, and a Tennessee Propellers 54 x 58, all while running the 2700cc engine. Conditions were as close as I can get to the same, and I think you'd agree I got pretty close. The biggest difference might be that I only had a spinner on the Sensenich, as it was too much trouble to make a spinner just to test the other three. The takeaway from the above chart is that the Sensenich is turning 560 rpm faster, and burning 7% more fuel than the Sterba, but only achieving 2 more mph (which the spinner will take care of). This testing was done before I had wheel pants, which is about a 12 mph penalty.

This test was done in May of 2008 running the 2700cc engine to compare a Sensenich 54x58 prop with a Sterba 52x60 (the same one I started flying with, and also tested above). Other tests made on this day proved that my TAS is within 1-2 mph of actual GPS speed, and that a spinner is good for about 1-2 mph improvement in speed. CHTs and EGT were averaged, and some columns were hidden to simplify the presentation. Also, I calculated climb speed over the 800'-7500 climb, as well as averaged it between 2000' to 4000' for each prop. Climb speed was held at 95 mph (despite what it says in the chart). Oil temp is a little high, but that's because of the steep climb. I normally climb out at about 120 mph, which keeps it cooler. I should point out that these aren't just a snapshot of best performance, these numbers are from a column of about 50 rows of identical numbers...speed is held to exactly the same number, altitude to within a 10' slice of air, and rpm doesn't change more than the 3 rpm resolution of the EIS...it shows exactly the same number for many seconds at a time. These are accurate numbers, is what I'm trying to say.
But the chart doesn't tell it all. While taxiing out with the Sterba, I immediately noticed it required more throttle to get moving from a stop. Acceleration and climbout was slightly more sluggish than the Sensenich, but nothing noticeable by anybody than me.
I did a fuel consumption test on the way to Oshkosh in 2008 running the 2700cc engine. I was flying at about 8500' and had the mixture set to the same setting in all cases (two bars showing on the air/fuel meter), which averaged around 1275F-1300F. I had to correct it for each run because mixture changes with throttle setting on the Ellison. That's a little lean of peak, but that's the way I run it at altitude. This data was taken at 56F degrees OAT and 29.98 inches of mercury barometer reading, burning mostly 100LL fuel (only because I'd refueled after leaving home).
This info is pretty stable data collected from my EIS data during the flight, usually at least 30 seconds within 5' of the the same altitude (although not all are at exactly 8500'), during stable flight (no diving or climbing). You get the idea... my KR is not a bad way to travel these days! I guess I mention this because the September issue of Kitplanes showed the new Arion Lightning kitplane doing 25 mpg doing 170 mph TAS at 7500' burning 6.7 gph, and I can do 166 at 40 mpg at 8500' burning 4.5, but again, I'm running lean of peak. It uses a Jabiru 3300cc engine, and mine is a 2700cc Corvair, for a few more weeks, anyway. It supposedly takes off and lands quicker, so it must have more wing area. That and the nose gear probably explains a lot of the difference, but I don't know how a 3300cc engine can drink that much at 7500'.
The data is saved as tab delimited text, and then it's an easy matter to import into Excel later. It's collected by using an executable called EISlog.exe, available for $10 (with free DB-9 serial connector) from Grand Rapids Technologies. Serial to USB converters also work, but I've found that when I use one of those with a hub (to connect XM-WX weather and GPS) things can get fouled up depending on which device snags what COM port first. It's very dependent on what you kick off first, and sometimes it's still hosed, so my most recent laptop purchase had a serial port, and I'm thoroughly pleased by the cooperation between USB and serial device now.
By its nature though, you have to remember to save the file and rename it after the flight. If the laptop craps out before you save it (like halfway through the flight), you lose the information. That's why I save the info a few times during the course of a long flight, just in case I forgot to plug it in or something. I use a $20 115V inverter that's wired to a breaker and mounted under the panel to provide laptop power, although a 12V converter could be used in the "cigarette lighter" if my laptop didn't require 19 volts!
I've posted an example of one of these files, in both raw space-delimited text, a html version of the spreadsheet (although it's missing the colored fields that make it easy to see where the measurements came from, and the Excel spreadsheet (preferred if you have Excel). This was a prop comparison run that I made between my usual Sensenich 54x58 propeller and a Sterba 56x56 propeller. Both runs are in the same file, because I never switched off the EIS while swapping props. The Sensenich prop was first. Note that the data is serial, so in the text file the last data point appears first. In the Excel file I've flipped the data so the first is at the top, but in the text file the end of the flight is at the top. This is easily done in Excel by inserting a column A that is nothing but a series of numbers, then using that column to invert the whole file, then deleting that column. The Excel file is formatted and labeled, making it far easier to understand what I did and what the results were. The large areas of green and blue were used to calculate average climb rates, while the yellow areas are top speeds. The two runs were around my usual test points, 1500' and 7500'.
See more at Tufting
Return to Mark Langford's KR2S Time Machine
Here's an example of the tabulated data that comes out of the EIS, which I collect with the laptop that I always fly with. You can see that it stores one data point per second, and it's as rock steady as I can fly the plane. If you do the numbers on OAT (outside air temperature), IAS (indicated airspeed), barometric pressure, and indicated altitude, I was doing 151 mph True Airspeed while getting 40.8 miles per gallon. I've done better with more agressive leaning, but that ain't bad for just flying along.
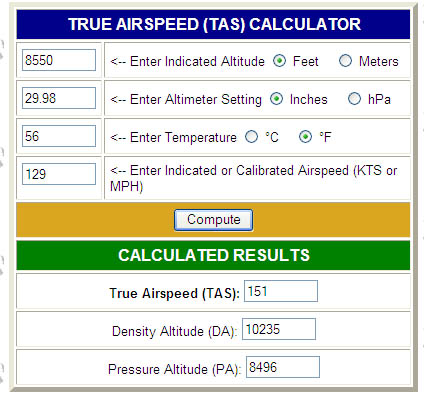
Since I'm a lazy scud, I just use this web-based True Airspeed Converter to do the dirty work.

In April of 2006 I did some tufting during various flight regimes, just playing around. I forget exactly what I was doing that caused this, but it's clear that some sort of Hoerner tips would stop it, and turn it into lift. Maybe I'll get around to testing that one of these days...
Return to Typical flight with 2700cc engine Excel file
Return to Typical flight with 2700cc engine HTML file
Return to Typical flight with 2700cc engine text file