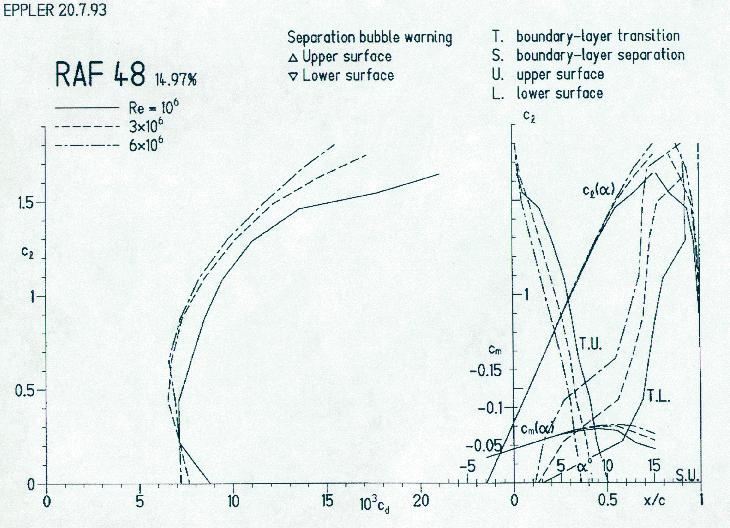
Above is a plot of RAF48 characteristics created from the coordinates using the "Eppler Code".
revised May 23, 1997
I discovered early into my design work that test data for the RAF48 is practically nonexistent. The only data I've been able to find was a sparse collection of Cl/Cd data. I talked a prominent aerodynamicist into running the airfoil coordinates through the "Eppler code" to generate a plot of its aerodynamic characteristics. The results were, as he put it "inconclusive". "They had pretty bad wind tunnels back then", he said, and trusts the Eppler code more than the experimental results in this case. Below are the coordinates for the RAF48 airfoil.
For those not familiar with such things, all of the numbers are in percent of chord. Basically, if you were building a wing with a 1" chord (yep, it'd be a small one!), you'd use the numbers below. So if you're plotting them on a CAD system, plot the points to scale, and then scale them up by whatever your chord length is (48 at the root, 30 or so at the tip). For those who do it by hand, multiply all the numbers by 48 first for the root coordinates, then multiply them all by 30 for the tip coordinates. Then plot them out using X for the chord length, Y for the height above or below the chord line. The first block of numbers is the top of the airfoil, the second (the negative ones) is for the bottom.
commonly available RAF-48 coordinates:
     x      y
  0.0000  0.0000
  0.0125  0.0260
  0.0250  0.0365
  0.0500  0.0520
  0.0750  0.0639
  0.1000  0.0730
  0.1500  0.0863
  0.2000  0.0953
  0.3000  0.1040
  0.4000  0.1020
  0.5000  0.0938
  0.6000  0.0794
  0.7000  0.0605
  0.8000  0.0402
  0.9000  0.0195
  0.9500  0.01005
  1.0000  0.0000

  0.0000  0.0000
  0.0125 -0.0165
  0.0250 -0.0234
  0.0500 -0.0316
  0.0750 -0.0369
  0.1000 -0.0403
  0.1500 -0.0441
  0.2000 -0.0458
  0.3000 -0.0456
  0.4000 -0.0433
  0.5000 -0.0390
  0.6000 -0.0336
  0.7000 -0.0265
  0.8000 -0.0183
  0.9000 -0.0100
  0.9500 -0.0064
  1.0000  0.0000
Below are RAF48 coordinates derived from a splining process. This gives more points along the curve to make plotting the airfoil more accurate, even if you're doing it by hand. Also, there is one more signicant digit, for you real sticklers for accuracy. You say your scale doesn't measure in hundred thousandths? Get a life!
high resolution RAF48 coordinates
   x           y
.00000	.00000
.00210	.00997
.00710	.01875
.01518	.02803
.02634	.03764
.04030	.04691
.05646	.05555
.07437	.06350
.09393	.07084
.11481	.08854
.13673	.08336
.15981	.08854
.18372	.09302
.20809	.09667
.23337	.09963
.25929	.10189
.28566	.10343
.31258	.10424
.33997	.10432
.36851	.10373
.39758	.10253
.42676	.10070
.45631	.09822
.48756	.09507
.51848	.09143
.54925	.08719
.58319	.08205
.61624	.07657
.64859	.07065
.68596	.06350
.72159	.05635
.77253	.04568
.82292	.03525
.87028	.02568
.91280	.01736
.94579	.01112
.97391	.00549
1.0000	.00000

.00000	 .00038  (no, I didn't skip the negative sign)
.00210	-.00761
.00709	-.01348
.01516	-.01892
.02631	-.02393
.04027	-.02876
.05642	-.03307
.07433	-.03676
.09388	-.03956
.11477	-.04174
.13669	-.04337
.15976	-.04459
.18367	-.04541
.20803	-.04593
.23332	-.04614
.25924	-.04611
.28560	-.04589
.31253	-.04551
.33991	-.04494
.36846	-.04418
.39752	-.04328
.42671	-.04225
.45626	-.04105
.48750	-.03966
.51843	-.03816
.54921	-.03652
.58315	-.03455
.61620	-.03249
.64856	-.03029
.68592	-.02756
.72156	-.02478
.77251	-.02055
.82290	-.01634
.87026	-.01252
.91279	-.00906
.94578	-.00634
.97390	-.00338
1.0000	 .00000
Above is a plot of RAF48 characteristics created from the coordinates using the "Eppler Code".
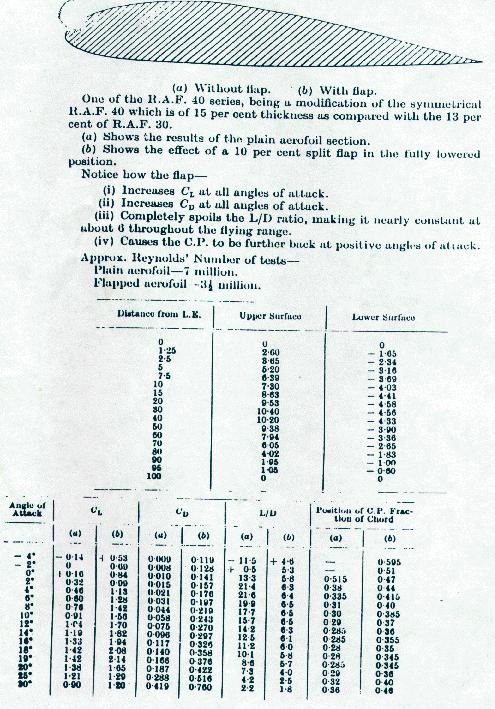
This is the only RAF48 information that I was able to locate, prior to having it run thru the Eppler code above.
Return to Mark Langford's opinions